
Ranking Items Using the RPA Report
This job aid describes how to use the Product Analysis Report (RPA) to evaluate and rank inventory items based on sales history. Use RPA to help you identify:
|
|
|
|
|
|
Product ranking is a way to rank (prioritize) like items based on some predetermined constants, such as grouping, criteria, or time frames. For example, like items can be all the items within a specific department code or class code, or all items from a specific vendor, or a combination of these groupings (such as department code and vendor code).
The RPA offers a variety of ranking criteria, including units sold, dollars sold, margin, GP%, on hand value, and YTD transaction. Select from a variety of ranking timeframes, including to-date, current period, YTD, last year, and last 12 months.
For more information about the RPA report, refer to the online help topics. From the Contents tab, open the Inventory book and then the Inventory Reports book.
Adding the ranking codes to items in IMU
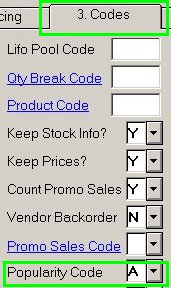
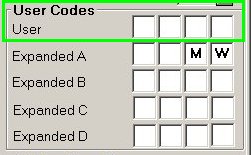
The ranking codes can be added to the item record in Inventory Maintenance (IMU). When running the RPA report, you can choose to update the Popularity Code field on the Codes tab in Inventory Maintenance (IMU) or the first group of the User Codes fields in IMU (just the User positions, not the Expanded A, B, C, or D positions). Then you can run other inventory reports using the rankings, to include or exclude items by ranking code.
Before you update the User Codes field
This applies to both single-store and multistore. When adding the ranking code to the User Codes field, first determine if you are already using the User positions for other purposes. For example, some telecom data updates the User Code fields, as do adds from Electronic Catalog, or you may be using the User positions for other business reasons.
If you plan to update the User positions with RPA rankings, do the following to move data that already exists in those fields and to prevent other data from being written to the User positions.
-
Use RICU (Item Code Update) to relocate existing data to the Expanded A, B, C, or D positions. Be sure that you fully understand how to run this utility before you use it. Contact the Eagle Advice Line (at 800-322-3077) if you have questions.
-
Change any reports in report queues that are set to update the User positions (such as telecom reports).
-
Review the Electronic Catalog options to be sure the Expanded A, B, C, or D positions are updated and not the User positions.
Multistore considerations
If you are multistore, it is important to note that the Popularity Code field is store specific and the User Codes field is master data.
When you run the RPA and update the Popularity Code field, if the popularity ranking is different in each store, the field will be updated accordingly. For example, if the ranking for an item is A in Store 1 and C and in Store 2, then the RPA report would update the Popularity Code field with an A in Store 1 and a C in Store 2.
If you are multistore and if you use more than one method to rank items, you can still use the User Codes field to place the rankings in IMU, but don't use the same User position for each store.
For example, you rank by units sold and dollars sold, and you have three stores. When running the RPA, you can use the Popularity Code field for one of the rankings, let's say Units Sold. Then when running the RPA for each store for Dollars Sold, use the User positions. Use the first position for Store 1, the second position for Store 2, the third position for Store 3. If you were to use the same User position, then when you ran the report for Store 2 it would overwrite the Store 1 ranking, replacing it with the Store 2 ranking. When displaying an item in IMU, all three code positions would be filled in with the product ranking code and you would need to know that the first position is the rank for Store 1, the second position is the rank for Store 2, and so on.
How items are ranked
Regardless of which analysis sequence you choose, the system does the following to determine the popularity code for items. The system will:
-
Identify all items that will be included on the report, and then determine the total for the ranking criteria selected.
-
Rank the items so that the first item that prints is the item with the highest number of the ranking criteria you selected when running the report.
-
Assign a popularity code to each item. The %Cum figure determines when the popularity code will change from A to B, B to C, and so on. The report keeps a running total of the criteria used for ranking and compares the running total to the grand total.
To set the ranking codes (A, B, C, D, X), the system uses 70/30 percent breakpoints. This is the default, but you can change it when you run the report. Using the 70/30 breakpoints, the rankings are A=70%, B=85%, C=95%, D=100%, X=none (0%). Only the A, B, C percents can be modified when you run the report.
1
Run the RPA— Print Setup page
-
From the Eagle Browser, click Applications and then click Reports Menu. Click Inventory Reports and then click Product Analysis (RPA). The Print Setup screen for RPA displays.
-
From the
 page, review the default entries and make changes if needed.
 -
Click Options.
2
Run the RPA— Options page
-
From the
 page, select the options you want to use for this report.
 -
From the Options list, select the field to update, the Popularity Code field or one of the User positions. If you want to run a "what if" report and not add the ranking to the items in IMU, do not select a field to update.
-
For Analysis Sequence, select the type of sales history to be used to rank the items. Then in the next field, select the sales period.
-
For Sales Period, select the period(s) of sales history that will be used.
-
Use the Exclude or Within fields to exclude items. Items recently added to the inventory file may not have enough sales history to rank and therefore could skew the ranking results.
-
Review the percent breakpoints, accept the defaults or change to your own settings. Only the percents for A, B, and C can be changed.
-
Click From / To.
3
Run the RPA— From / To page
-
From the
 page, select the options you want to use for this report.
 -
At Store, enter a store number for the report.
-
At Ranking Group, use groupings when your from/to range includes more than one group and you want all items in a single group to be ranked together. For example, if the from/ to department range is 1 to 9, to rank all department 1 items together with only department 1, select Ranking Group D - Department. To rank all items in departments 1 to 9 as a single group, leaving the Ranking Group field blank.
-
At Max # per Group, leave it blank to print all items, or enter a maximum number to print.
-
Use the remaining from and to fields to select the range of items that you want to include on the report.
-
Click Code Selection.
4
Run the RPA— Code Selection page
-
Using the
 page is optional.
 -
If you want to further refine the items that are selected for the report, fill in your options for the fields on this page.
5
Run the RPA
-
After filling in your criteria for running this RPA, click Run.
-
The report processes and spools/prints. The items are ranked based on the criteria you used to run the report.
6
View the rankings
View the rankings in any of the following:
-
on the spooled / printed copy of the RPA report
-
per item in Inventory Maintenance (IMU)
-
reports, including ROP, RSO, RIS, RIH, RIV
-
viewers, Inventory viewer and Business Advisor