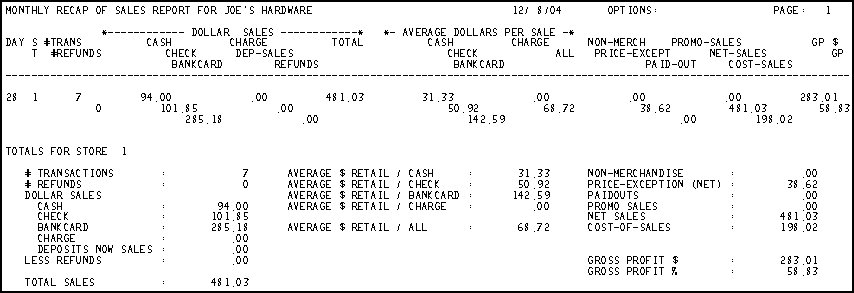
This topic provides an example of the Monthly Recap Report (RMR) and definitions of the fields on the report. For more information about RMR and procedure steps for running the report, click here to go to the online help topic. This report is available from both the Eagle Browser and Network Access.
The following is an example of the report. Click a field in the report to take you to the field definition.
The following is a list in alphabetical order of the fields on the RMR report.
# Refunds— Total number of refund transactions for the day (or for the Store in the Totals section of the report). This number is from the End of Day Sales Totals (RDS) report, the sum of the Refunds & Returns (Cash, Check, Bankcards) and Credit & Returns (Charge).
# Trans— Total number of transactions for the day (or for the Store in the Totals section of the report).
Average Dollars per Sale— By day and in the Totals section of the report. The average dollar sales amount by category (cash, check, etc.). Calculated as total sales amount divided by number of transactions.
Cost– Sales— By day and in the Totals section of the report. Total cost of sales from the Daily Inventory Update Report (RDI), the Net Sales field.
Dollar Sales— By day and in the Totals section. The total amount of sales by category (cash, check, etc.) Total is the sales total for each category minus Refunds. The Dollar Sales figures include sales tax. The Dollar Sales figures are from the following fields on the End of Day Sales Totals (RDS) report:
|
RMR Dollar Sales |
RDS Transaction Totals |
|
Cash |
Cash Sales |
|
Check |
Check Sales |
|
Bankcard |
Bankcard Sales |
|
Charge |
Charge Sales |
|
Dep– Sales |
Dep. Now Sales |
|
Note: Refunds are not included in any of the categories above. |
|
|
Refunds |
Refunds & Returns (Cash, Check, Bankcards) |
GP— By day and in the Totals section of the report. Gross Profit. A calculated field using Net Sales from the End of Day Sales Totals (RDS) report and Cost Sales from the Daily Inventory Update Report (RDI).
GP $— By day and in the Totals section of the report. Gross profit dollars from the Daily Inventory Update Report (RDI).
Net– Sales— By day and in the Totals section of the report. Total amount of net sales from the End of Day Sales Totals (RDS) report. This is total sales minus tax.
Non– Merch— By day and in the Totals section of the report. Total amount of all non-merchandise sales (freight, labor, etc.). This is from the End of Day Sales Totals (RDS) report, the Non Merchandise field in the Totals section.
Options— The option codes used when running this report. For a definition of each Option, click here to go to the help topic.
Paid– Out— By day and in the Totals section of the report. Total amount paid out. This is from the End of Day Sales Totals (RDS) report, the Paid Outs field in the Cash Balancing Worksheet section.
Price– Except— By day and in the Totals section of the report. Net amount of price exceptions. This is from the Daily Inventory Update Report (RDI), the POS Markdowns/Markups field.
Promo– Sales— By day and in the Totals section of the report. Total amount of promotion sales. This field is from the Daily Inventory Update Report (RDI). It is the sum of all individual items on the RDI report with an S under the D in the Codes column. This figure includes all promotion methods (items with a promo price in Inventory Maintenance and items sold using the Promo key in POS).