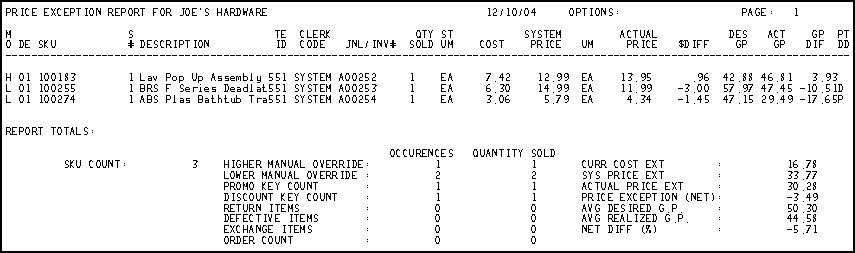
This topic provides an example of the Price Exception Report (RPE) and definitions of the fields on the report. For more information about RPE and procedure steps for running the report, click here to go to the online help topic. This report is available from both the Eagle Browser and Network Access.
The following is an example of the report. Click a field in the report to take you to the field definition.
The following is a list in alphabetical order of the fields on the RPE report.
$ Diff— Dollar difference between the system price (extended) and the actual price.
Act GP— Actual gross profit percent.
Actual Price— Actual price paid for the item on the POS transaction.
Actual Price Ext— Totals section of the report. Actual price extension, the sum of the actual price column times the number sold.
Avg Desired G.P.— Totals section of the report. Average desired gross profit percent, the sum of the desired GP % column divided by the number of items.
Avg Realized G.P.— Totals section of the report. Average actual gross profit percent, the sum of the actual GP % column divided by the number of items
Clerk Code— Clerk who processed the transaction at POS.
Curr Cost Ext— Totals section of the report, sum of the costs of all items.
DE— Department. Note that an asterisk to left of the department code indicates that the item was returned as a defective.
Defective Items— Totals section of the report, total (number of occurrences and quantity sold) of items returned at POS and marked as a defective item. Items with an asterisk (*) to the left of the DE (department) column.
Description— Description of the item, from the item record in Inventory Maintenance (IMU).
Des GP— Desired gross profit percent, from the item record in Inventory Maintenance (IMU).
Discount Key Count— Totals section of the report, total (number of occurrences and quantity sold) of items sold with a D under the PD (promo discount) column.
Exchange Items— Totals section of the report, total (number of occurrences and quantity sold) of items returned at POS and marked as an exchange for defective.
GP Dif— Difference between the desired gross profit percent and the actual gross profit percent.
Higher Manual Override— Totals section of the report, total (number of occurrences and quantity sold) of items sold for a price higher than the system price. Items with an H under the MO (manual override) column.
Jnl/Inv#— Document number for this transaction.
Lower Manual Override— Totals section of the report, total (number of occurrences and quantity sold) of items sold for a price lower than the system price. Items with an L under the MO (manual override) column.
MO— Manual Override. At POS, the clerk entered a new price to override the system price. L = price lower than system price. H = price higher than system price.
Net Diff (%)— Totals section of the report. Net gross profit percent difference between actual GP% and desired GP%.
Options— The option codes used when running this report. For a definition of each Option, click here to go to the help topic.
Order Count— Totals section of the report, total (number of occurrences and quantity sold) of items that are exceptions due to overriding the original bid price.
PD— Promotion Discount. P = Promo key used to post the item. D = Disc (discount) key used to post the item. * = item is marked as Discountable in Inventory Maintenance (IMU). S = item has an active promo price in Inventory Maintenance (IMU). O = an invoiced order where the actual price is different from the original bid price. Q = price posted is from an Open Quote.
Price Exception (Net)— Totals section of the report. Total difference between system supplied price and price override. The sum of the $Diff column.
Promo Key Count— Totals section of the report, total (number of occurrences and quantity sold) of items sold with a P under the PD (promo discount) column.
Qty Sold— Total number of items sold on the line item.
Return Items— Totals section of the report, total (number of occurrences and quantity sold) of items returned at POS and marked as a regular return.
SKU— The item number of the SKU, from the item record in Inventory Maintenance (IMU).
SKU Count— Totals section of the report, the total number of items on this RPE report.
ST UM— Stocking unit of measure, from the item record in Inventory Maintenance (IMU).
Sys Price Ext— Totals section of the report. The sum of the extended price of each item. The extended price is calculated as Qty Sold times Actual Price.
System Price— Price for the item based on the item record (in Inventory Maintenance - IMU) and the customer record (in Customer Maintenance - MCR). The system uses Best Pricing and looks at all prices available to the customer to determine the system price (for example, quantity breaks, price matrix, and promo pricing). If the RPE report was run with Option W (Items Sold on Order Created a Bid), the original bid price prints. Note that lumber items using a conversion factor print un-extended prices in pricing units of measure.
TD— Trade Discount. I = Immediate terms discount, manual trade discount, or automatic trade discount (based on the customer record in Customer Maintenance - MCR).
TE ID— Terminal ID. The number of the terminal where the transaction was processed.