Using Vendor Report Card
Features of Vendor Report Card
Vendor Report Card provides Eagle customers with insights to vendor performance. Most Eagle customers have expanded their product lines over the years. Many Eagle customers have shifted as much as 25% to 40% of their merchandise purchases to direct-to-vendor v's the more traditional cooperatives such as Ace or True Value.
Vendor Report Card seeks to answer the business question: “how is my independent vendor performing?”
- Report Card – Excel output with metrics for:
-
- Sales
- Inventory
- Orders
- Freight and Adjustments
- Basic Program Information
-
- Vendor Report Card definition UI in Compass
- Vendor Viewer
- Vendor Report Card Viewer
- Market Basket by Category Enhancements
- Mapped MVR Contacts
- Mapped Vendor Change Log
- 100+ new fields in Eagle MVR and Compass
Minimum Eagle and Eagle for Windows PCO Levels
- Compass – 12.1.0.280
- E4W – 24.2913.001
- PCO – 36.0745
Eagle for Windows Licensing Options
- E4W1325 – Vendor Report Card on System = Y
- E4W1017 – Compass Client on System = Y
- E4W8829 – Compass Analytics on System = Y
- E4W1096 – Vendor Viewers on System = Y
- E4W1032 – Purchase Order Lifecycle on System = Y
-
-
- Option 9676 – 365 days
- Option 9677 – 999 days
- Option 9617 – 1, 2, 3, 4, 5, 6, 7, 8, 9, A, B, C, D, E, F, G
- MSY2001 – Compass Database on System = Y
- E4W43 – Inventory Transaction Register = Y
- E4W8628 – Advanced Receiving

Advanced Receiving is required for full analysis of freight and other charges. If you don’t have advanced receiving, you will not want to select the checkbox for “freight and adjustments” in the report card configuration screen.
Eagle Options Required
- Option ID 496 – Large Field Sizes
- Option ID 8857 – 10 Digit PO Numbers
- Option ID 100 – Assign PO Automatically
- Option ID 101 – Set Next Available PO Number
Compass Data-Cubes Required
Inventory Valuation Cube in Compass (IN_SNAP) or Historical Inventory Cube in Compass (IN_SNAPEXT)

These cubes may need to be derived if they don’t exist in your system already. Talk to your implementation specialist.
Eagle for Windows Security Bits
- MSE 1065 – Ability to access the VRC tabs of MVR
- MSE 1066 – Ability to change fields on the VRC tabs of MVR
- MSE 834 – Access to Compass Analytics (if building any reports)
Getting Started with Vendor Report Card
Adding a Vendor Report Card Definition
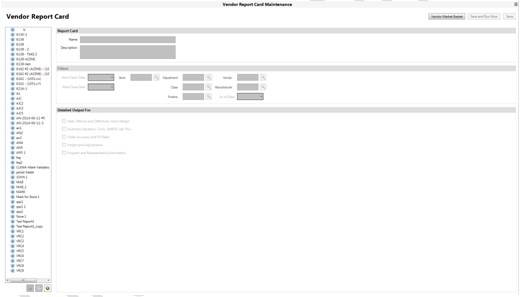
- Add a report card definition on the left panel by clicking the green plus sign
- Fill definition page as desired
If you do not have Advanced Receiving, do not check the box for “Freight and Adjustments”
- Save, or Save and Run Now – this places the results in the Spooled Task pages in Compass
These report cards may also be scheduled in a task.
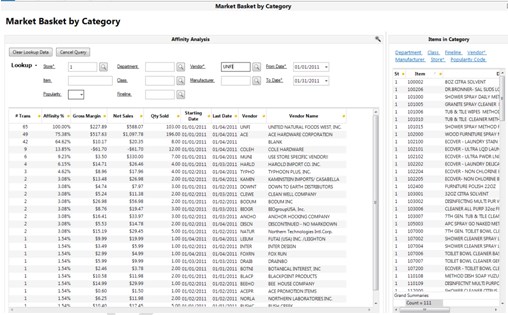
Vendor Market Basket
The suite of Market Basket Analysis reports are designed to provide you with information about the items or types of items that sell most frequently with a chosen vendor. Items selected by the filter area show on the right while category information shows in the main area. To see line item details associated with a vendor, double click that row and a new window will show the list of items.
Vendor Viewers
Vendor Viewer and Vendor Report Card Viewer
- Viewers allow changes to Eagle data via a grid. Both of these viewers are included in the Vendor Report package.
- Security / Option settings for Viewers to work.
-
- MSE813 – Allowed to change vendor name
- MSE176 – Allow changes to vendor information
- MSE175 – Ability to delete vendors
- MSE174 – Ability to add vendors
- MSE173 – Ability to view vendor history
- MSE172 – Ability to view basic vendor information
- VRC – MSE1066 – Ability to change tabs 7, 8, and 9 in MVR
- VRC – MSE1065 – Ability to view tabs 7, 8, and 9 in MVR
- VRC – E4W1325 – VRC on system
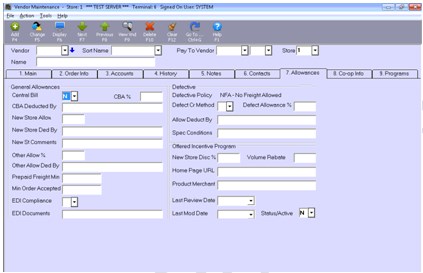
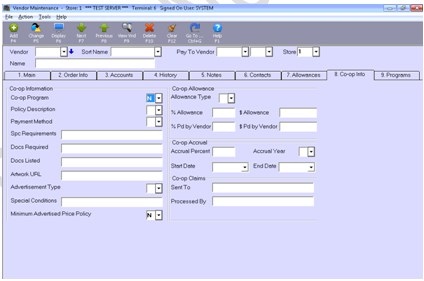
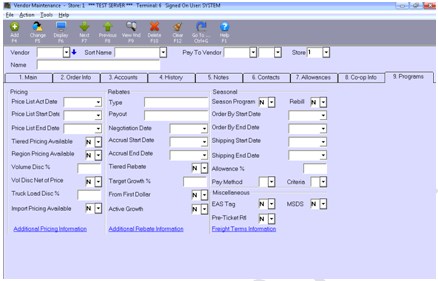
MVR Enhancements – UI and Fields
Note: Over 100 new fields in tabs 7, 8, and 9 of MVR
These new fields are also tied to a Compass Viewer called “Vendor Report Card Viewer” which is accessible from the Compass Menu.
Report Card Output
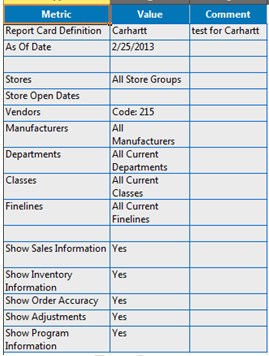
- Report Definition Tab
- Report Card Definition – Name given to the Report Card
- As of Date – Point in time that determines the “last possible date” for sales, inventory valuation, orders, and adjustments
- Remaining fields are self-explanatory
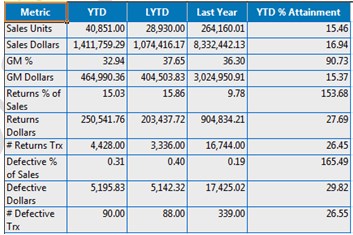
- Sales Tab
-
These metrics use “current” department, class, fineline, and manufacturer – “historical” vendor, or vendor at time of transaction is used for vendor.
-
- Net Sales Units, Net Sales Dollars, GM%, GM Dollars – From sales detail – YTD and LYTD are “as of date” or today, if report card definition “as of date” is blank
- Returns Sales Dollars, Defective Sales Dollars, and Number of Transactions – From Sales Detail – Returns and Defectives percentages are using Total Sales as the denominator. Number of Transactions increment wherever a return or defective “unit” exist.
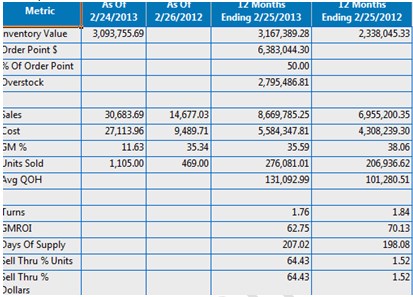
- Inventory Tab
Things Vendor Report Card checks for:
- MIC102 – which cost should be used – Average or Replacement
- Code first checks to see if INsnap_ext table exists and if so, uses that table:
-
Target Average
-
Target Replacement
-
Overstock Average
-
Overstock Replacement
-
-
- If INsnap_ext doesn’t exist on the system, these rows are blank
- “As of Columns” find closest date to report card’s “As of Date”, uses today if blank or if “As of Date” is in the future
- Keep Stock Data = Y
These metrics use “current” department, class, fineline, and manufacturer – “historical” vendor, or vendor at time of snapshot is used for vendor.
- Inventory Value – This is an average value – adds up all entries it finds for desired time period and divides by the number of entries found. For most recent 12 months, it adds the current value to the total, and adds one to the denominator.
- If INsnap_ext doesn’t exist, we check for INsnap – INsnap only has Average Cost however.
- Order Point $, % of Order Point, Overstock –
- If INsnap_ext is available, we pull “Target Inventory At Average (or replacement)” - else cells are left blank
- Sales – Net Sales from Sales Detail for desired time period
- Cost – Cost from Sales Detail for desired time period
- GM% – GM% from Sales Detail for desired time period
- Units Sold – Net Sales Units from Sales Detail for desired time period
- Avg QOH – Add the QOH for every record in either INsnap or INsnap_ext divided by number of entries found
- Turns – COGS / Average Inventory Value – both factors are for the same time period
- GMROI – Turns * GM%
- Days of Supply – 365 / Turns
- Sell Thru % Units – Units Sold / (QOH + Units Sold)
- Sell Thru % Dollars – Dollars Sold / (Current On Hand Value + Dollars Sold)
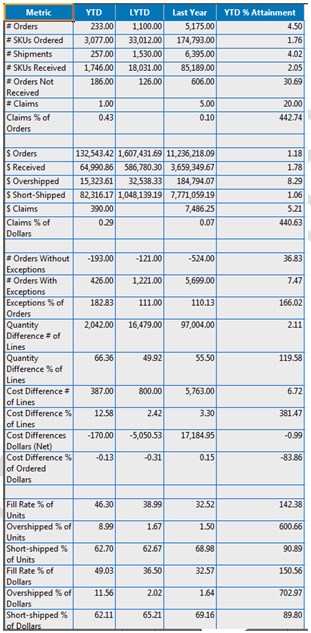
- Orders Tab
Things Vendor Report Card checks for:
- Only “claims” rows include type C and D orders – all other counts and dollars exclude type C and D orders
- Open Purchase Orders (those that still exist in the PO Header or PO Detail tables) are always excluded from analysis.
- Lead Times for this application are computed as the number of days between the last receipt of items and the original “Date of Record” (date of first event – 201, 202, 602)
- Some of the values on the Program tab are numberic calculations such as dollars received last year. These values are summed across stores and are taken directly from the VM table. The time period for those values can be different from used on the Orders tab, open POs are included in the VM numbers but not the order analysis and various department / class / fineline filters will not be applied to the values on the Program tab. So, it should be alarming if the values on the Program tab don’t exactly match the corresponding values on the Orders tab.
Field Definitions
- # Orders – count of all purchase orders that have their first event (“date of record”) as a 201, 202, or 602.
- # Order Lines – count of distinct Store/SKU on the purchase orders above – if a PO has both a 201 and a 602 for example, we only count the Store/SKU for the first event
- # Shipments – count of distinct dates for each PO for each store that was received on any of the POs above.
- # SKUs Received – counting distinct PO / Store / Item on the shipments
- # Orders Not Received – List of POs in “# Orders” that aren’t received, or still in MPO
- # Claims – count of type C and D POs
- Claims % of Orders – calculation (# Claim Orders / (# Claim Orders + # Orders)
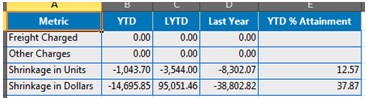
- Freight Tab
- Two new fields in Advanced Receiving Header
-
- Accumulated Freight
- Accumulated Other Charges
- From ITR
-
- Shrinkage Qty
- Shrinkage Cost
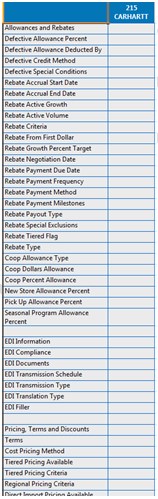
- Program Tab
- Various fields from MVR
-
- New fields from new tabs in MVR
- Other standard fields in MVR
- If fields are different for each store, and multiple stores are selected in the report card, then each unique field value will be displayed
- If multiple vendors are included in the report card, then a column for each vendor will be reported