The Product Analysis Report (RPA) evaluates and ranks inventory items based on sales history. This topic provides an example RPA report and explains how the system calculates ranking codes.
For more information about running the RPA report, refer to the RPA help topic or the job aid.
Product ranking is a way to rank (prioritize) like items based on some predetermined constants, such as grouping, criteria, or time frames. For example, like items can be all the items within a specific department code or class code, or all items from a specific vendor, or a combination of these groupings (such as department code and vendor code).
The RPA offers a variety of ranking criteria, including units sold, dollars sold, margin, GP%, on hand value, and YTD transaction. Select from a variety of ranking timeframes, including to-date, current period, YTD, last year, and last 12 months.
Regardless of which analysis sequence you choose, the system does the following to determine the popularity code for items.
First, the system identifies all items to be included on the report, and then determines the total for the ranking criteria selected.
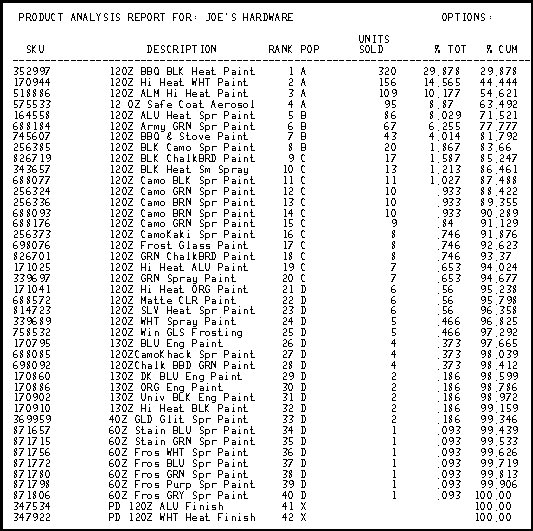
On the example report, the ranking criteria is units sold over the last 12 periods (Analysis Sequence 1 and Sales Period 5 were the options selected when running the report). The total units sold for all items on the report is 1071.
Next, the system ranks the items so that the first item that prints is the item with the highest number of the ranking criteria you selected when running the report.
On the example report, the first item that prints is the item with the highest units sold over the last 12 periods. On the report, this is SKU 352997 with 320 units sold.
Finally, the system assigns a popularity code to each item. The figure in the %Cum (cumulative) column determines when the popularity code will change from A to B, B to C, and so on. The report keeps a running total of the criteria used for ranking and compares the running total to the grand total.
On the example report, for the first item, SKU 352997, 320 units is 29.878% of 1071 (total units sold). The percent displays in both the %Tot column (to the right of the Units Sold column) and the %Cum column (to the left of the QOH column).
The next item, SKU 170944, sold 156 units, which is 14.565% of 1071. That percent prints in the %Tot column. The system then adds 14.565 to 29.878, for a total of 44.444% and prints that percent in the %Cum column.
The report continues in this fashion, adding the %Tot for the item to the %Cum from the previous item, increasing the %Cum each time. When the %Cum is greater than the % Breakpoint you specified when running the report, the popularity code changes.
To set the ranking codes (A, B, C, D, X), the system uses 70/30 percent breakpoints. This is the default, but you can change it when you run the report. Using the 70/30 breakpoints, the rankings are A=70%, B=85%, C=95%, D=100%, X=none (0%). Only the A, B, C percents can be modified when you run the report.
On the example report, the %Cum exceeded the % Breakpoint between SKU 575533 and SKU 164558. Since the % Breakpoint for A ranked items is 70% and the %Cum for SKU 164558 is 71.521%, this is the first item to receive a popularity code of B.
![]()
It is possible for two items to have exactly the same amount in the ranking criteria. If this occurs when the %Cum exceeds the % Breakpoint, the popularity code will not change. This prevents items with the exact same amount in the field used for ranking from having different popularity codes. For example, if SKU 826719 had sold 20 units (instead of 17), SKU 826719 would also have a popularity rank of B, even though the %Cum of 85.247 exceeds the % Breakpoint of 85.
The following is an example of the RPA report, run to rank items based on units sold over the last 12 periods.
![]()
If the Units Sold prints with an asterisk after the number, this means RPA found all the items it needed for a given ranking, but there were additional items on file that had just as many units sold as the previous item that was ranked (in other words, there was a "tie" for the given ranking). This means that the given ranking actually has a higher percentage of units sold than it should.